A Note On Investment Strategies Involving Options


 <<Previous
INVESTMENT STRATEGIES INVOLVING OPTIONS Contd..
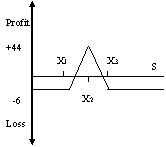
Butterfly SpreadA butterfly spread is an option
strategy involving four options of the same type, having the same expiration
date but three different exercise prices. A butterfly spread can be created
by buying an option each at two extreme strike prices (X1 and X3) and
selling two options with a strike price (X2), which is halfway between X1
and X3. The strike price should be so chosen that X1 < X2 < X3. Generally,
X2 should be close to the prevalent market price. Example:An investor buys two March call options on shares of Reliance, one at a premium of Rs. 25 per share with a strike price of Rs.200 (X1) and the other at a premium of Rs. 15 per share with a strike price of Rs. 300 (X3). The investor also sells two March call options at a premium of Rs. 17 per share with a strike price of Rs. 250 (X2). The payoff table (Refer Table 8) of a butterfly spread using calls will be:
Table 8: Payoff using Butterfly Spread
|
S
|
X1
|
X2
|
C
|
Payoff
|
Net Profit
|
|
180
|
200
|
250
|
300
|
6
|
0
|
-6
|
|
200
|
200
|
250
|
300
|
6
|
0
|
-6
|
|
220
|
200
|
250
|
300
|
6
|
20
|
14
|
|
240
|
200
|
250
|
300
|
6
|
40
|
34
|
|
250
|
200
|
250
|
300
|
6
|
50
|
44
|
|
260
|
200
|
250
|
300
|
6
|
40
|
34
|
|
280
|
200
|
250
|
300
|
6
|
20
|
14
|
|
300
|
200
|
250
|
300
|
6
|
0
|
-6
|
|
320
|
200
|
250
|
300
|
6
|
0
|
-6
|
In the case of a butterfly spread using calls, the payoff
will be:
|
Payoff when,
|
From Call bought at X1
|
From Two Calls sold at X2
|
From Call bought at X3
|
Total Payoff
|
|
S � X1
|
0
|
0
|
0
|
0
|
|
X1 � S � X2
|
S � X1
|
0
|
0
|
S � X1
|
|
X2 � S � X3
|
S � X1
|
- 2 * (S � X2)
|
0
|
X3 � S
|
|
S > X3
|
S � X1
|
- 2 * (S � X2)
|
S � X3
|
0
|
* These payoffs will hold true only when X2 is halfway
between X1 and X3
Investors adopt the butterfly spread strategy when they are certain that the
prices will fluctuate significantly and want to limit their downside risk.
This strategy limits both the upside potential as well as the downside risk.
The upside potential is limited to the difference between (the middle
exercise price and the lower exercise price) less the net option premium
while the downside risk is limited to the amount of net option premium paid
to create the spread.
More...
TABLE 9: PAYOFF USING CONDOR SPREAD
TABLE 10: PAYOFF FROM LONG STRADDLE
TABLE 11: PAYOFF FROM LONG STRANGLE
TABLE 12: PAYOFF USING STRIPS
TABLE 13: PAYOFF USING STRAP
CONCLUSION
EXHIBIT I
ADDITIONAL READING & REFERENCES
2010, ICMR (IBS Center for Management Research).All rights reserved. No part of this publication may be
reproduced, stored in a retrieval system, used in a spreadsheet, or transmitted
in any form or by any means - electronic or mechanical, without permission.
To order copies, call +91- 8417- 236667 or write to ICMR,
Survey No. 156/157, Dontanapalli Village, Shankerpalli Mandal,
Ranga Reddy District,
Hyderabad-501504.
Andhra Pradesh, INDIA.
Mob: +91- 9640901313, Ph: +91- 8417- 236667,
Fax: +91- 8417- 236668
E-mail: info@icmrindia.org
Website: www.icmrindia.org
|

