Enterprise Risk Management at ABN AMRO


<<Previous
Market Risk
|
Market risk was the possibility of movements in financial
markets changing the value of the bank's trading portfolios. Market risk arose
from the bank trading on behalf of clients and on its own account. In trading
activities, risk arose both from open (unhedged) positions and from imperfect
correlations between market positions that were intended to offset one another.
ABN AMRO measured and monitored different market risk factors such as interest
rate sensitivity, open currency position, stock prices, spread sensitivities,
greeks (delta, gamma, vega, rho). In addition, ABN AMRO calculated and set
limits for VAR, stress tests, scenario analysis, position concentration and
ageing. Market risks were monitored at different levels, starting from single
trading portfolios to key aggregation levels. |
|
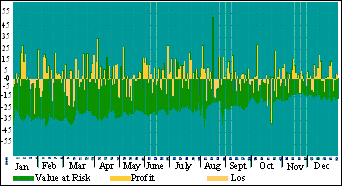
Figure (i)
ABN AMRO: Value Risk versus Hypothetical Profit & Loss for Trading
Portfolios for 2002(in million)


Source: ABN AMRO Annual Report, 2002 Internal models
met regulatory requirements and were approved by the Dutch central bank for the
calculation of solvency requirements for market risk.
ABN Amro used VAR as the primary tool for day-to-day monitoring of
trading-related market risk. VAR was calculated by Historical Simulation, based
on four years of historical data. The bank used a one-day holding period,
relative changes of historical rates and prices, a 99% confidence level and
equally weighted simulations. The VAR was reported daily to the senior
management of the BUs, GRM and members of the Managing Board.
Exhibit: XI
ABN AMRO: VAR for Trading Portfolios


|
VaR for trading portfolios (99% confidence
level, one-day holding period)
(in million)
|
31/12
2002
|
Minimum
|
Maximum
|
Average
|
Average in 2001 |
|
Financial Markets
|
16
|
13
|
51
|
27
|
33 |
|
Global Equity
|
7
|
4
|
15
|
8
|
10 |
|
Total trading
|
17
|
13
|
49
|
30
|
41 |
Source: ABN AMRO Annual Report, 2002
The effectiveness of VAR was assessed by back testing, which counted the number
of days when the losses were bigger than the estimated VAR figure.
Theoretically, with a 99% confidence level, it was expected that on one out of
every 100 trading days a loss which exceeded the VAR might occur. The back
testing was performed on the actual profit and loss (P&L) and a hypothetical
P&L, which measured a P&L on market risk exposure against movements of financial
market prices and excluded effects of commissions, origination fees and
intra-day trading. The results of the back testing on the actual and the
hypothetical P&L were regularly reported to the Dutch central bank. The
hypothetical back testing was also an essential instrument for validation of the
bank's internal models.
The back-testing result showed that the hypothetical P&L exceeded the calculated
VAR only on two days in 2002. This was within model expectations. Extraordinary
events, for example July-October 1998, in the historical data, along with
certain conservative assumptions made when aggregating risk factors, had led to
a relatively conservative VAR estimate.
The VAR measure was supplemented by a series of stress tests and scenario
analyses, which shed light on the behavior of a portfolio under extreme market
events. Stress tests had been developed internally to reflect specific
characteristics of the bank's portfolios, while scenarios were based on
historical market events, like the financial markets crisis of July-October
1998. Both stress tests and scenario analyses were performed daily for each
trading portfolio and at several aggregation levels, including the bank-wide
total.
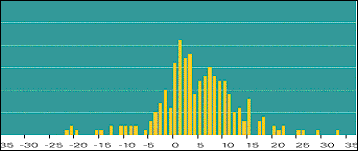
Figure (ii)
ABN AMRO: Distribution of Daily Revenue for FM for 2002


Group Asset and Liability Management (GALM) protected the earnings and capital
position of the bank from adverse interest rate and currency movements and
managed the bank's liquidity. The Group Asset Management and Liability Committee
(Group ALCO), whose members were drawn from finance, treasury and risk
management, had global responsibility across the SBUs. It also monitored the
activities of local asset and liability management committees in the bank's home
markets. ALCOs existed in other countries, but their interest risk came under
the market risk management framework monitored by GRM.
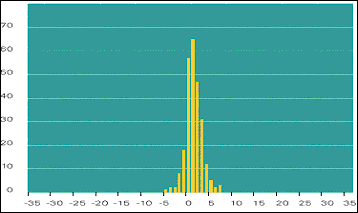
Figure (iii)
ABN AMRO: Distribution of Daily Revenue for GED for 2002 (in millions)


Note: The Graphs show the distributions of actual daily revenues in 2002 from
activities (including commissions, fees, origination profits, and so on) for
each BU: Financial Markets (FM) (Graph 2) and Global Equity (GED) (Graph 3).
Overall, a distribution around a positive average was visible, especially for
GED where commissions were an important source of revenue.
Source: ABN Amro Annual Report, 2002
More >>
©2003, . All rights reserved. No part of this publication may be reproduced, stored in a retrieval system, used in a spreadsheet, or transmitted in any form or by any means - electronic or mechanical, without permission.
To order copies, call 0091-40-2343-0462/63 or write to ICMR,
Survey No. 156/157, Dontanapalli Village, Shankerpalli Mandal,
Ranga Reddy District,
Hyderabad-501504.
Andhra Pradesh, INDIA.
Mob: +91- 9640901313, Ph: +91- 8417- 236667,
Fax: +91- 8417- 236668
E-mail: info@icmrindia.org
Website: www.icmrindia.org
|


