A Note On Investment Strategies Involving Options


 <<Previous
INVESTMENT STRATEGIES INVOLVING OPTIONS Contd..
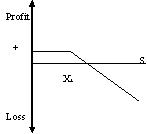
Example:A sells a European call option on a share
of LG Electronics at a premium of Rs. 3 per share on January 01, 2002. The
strike price is Rs.65 and the contract matures on June 30, 2002. The payoff
table (Refer Table 3) shows the payoffs for A on the basis of different spot
prices at maturity of the option. It is clear from the graph that the upside
potential is limited to a maximum of Rs.3 per share, which has been received
as option premium. However, the downside risk is unlimited and the investor
may experience huge losses, if the market does not move according to his
expectations.
Table 3: Payoff from Selling a Call Option (Rs.)


|
S
|
Xt
|
C
|
Payoff
|
Net Profit
|
|
62
|
65
|
3
|
0
|
3
|
|
63
|
65
|
3
|
0
|
3
|
|
64
|
65
|
3
|
0
|
3
|
|
65
|
65
|
3
|
0
|
3
|
|
66
|
65
|
3
|
-1
|
2
|
|
67
|
65
|
3
|
-2
|
1
|
|
68
|
65
|
3
|
-3
|
0
|
|
69
|
65
|
3
|
-4
|
-1
|
|
70
|
65
|
3
|
-5
|
-2
|
|
71
|
65
|
3
|
-6
|
-3
|

Payoff: Min (Xt – S, 0)
Net Profit = Payoff plus ‘C'
Here ‘C'represents Cash Inflow
Investors adopt this strategy when they are certain that the market will not
rise, but are not sure whether it will fall or not. This strategy should be
used carefully because an investor may incur losses if the market suddenly
enters a bullish phase.
Put Options:
The European put option is the reverse of a call option deal. Let us
understand the basics of put option with the help of the following example:
Example:
B buys a European put option on a share of Philips at a premium of Rs. 3 per
share on October 31, 2002. The strike price is Rs.70 and the contract
matures on December 31, 2002. The payoff table (Refer Table 4) shows the
fluctuations of profit with a change in the spot price.
Investors may buy put options when they feel that the market will fall
significantly in the near future. In this case, the upside potential is
maximum at the point when S falls to zero while the downward risk is limited
to the premium paid.
On the other hand, the seller of the put option has a payoff chart
completely reverse to that of the put options buyer. The loss that he can
incur is more significant (Xt – P) but the profit potential is limited to
the amount of premium received. An investor adopts this strategy when he is
sure that the market will not fall but is unsure whether it will rise or
not.
More...
TABLE 4: PAYOFF FROM BUYING OF PUT OPTION (RS.)
TABLE 5: PAYOFF FROM SELLING A PUT OPTION
TABLE 6: PAYOFF FROM BULL SPREAD USING CALLS
TABLE 7: PAYOFF FROM BEAR SPREAD USING CALLS
TABLE 8: PAYOFF USING BUTTERFLY SPREAD
TABLE 9: PAYOFF USING CONDOR SPREAD
TABLE 10: PAYOFF FROM LONG STRADDLE
TABLE 11: PAYOFF FROM LONG STRANGLE
TABLE 12: PAYOFF USING STRIPS
TABLE 13: PAYOFF USING STRAP
CONCLUSION
EXHIBIT I
ADDITIONAL READING & REFERENCES
2010, ICMR (IBS Center for Management Research).All rights reserved. No part of this publication may be
reproduced, stored in a retrieval system, used in a spreadsheet, or transmitted
in any form or by any means - electronic or mechanical, without permission.
To order copies, call +91- 8417- 236667 or write to ICMR,
Survey No. 156/157, Dontanapalli Village, Shankerpalli Mandal,
Ranga Reddy District,
Hyderabad-501504.
Andhra Pradesh, INDIA.
Mob: +91- 9640901313, Ph: +91- 8417- 236667,
Fax: +91- 8417- 236668
E-mail: info@icmrindia.org
Website: www.icmrindia.org
|